QuickTime Video
Fire behaviour
This section focuses on the attributes of fire — including fire intensity and ignition taxonomy — and how to measure these attributes.
Fire intensity
The most important measure of fire behaviour is fire intensity.
Fire intensity (I) represents the heat released per meter of fire front (kW/m of fire front). It is a function of (1) heat yield of fuel (kilojoules/kg), (2) amount of fuel per unit area (kg/m2) and (3) the rate of forward spread of fire front (km/h).
This relationship is described by Byram’s fire intensity equation:
I = Hwr
where,
I = intensity (kW/m)
H = heat yield of fuel (J/g)
w= fuel consumed (kg/m2)
r = spread (m/sec)
It is important when calculating intensity to pay attention to the units of measurement to ensure calculations are correct.
Flame height can also be a useful indicator of intensity. Although the following table is for open forests in southern Australia, it illustrates how fire intensity and flame height can be related.
| Rating | Fire Intensity kWm2 | Max Flame Height m | Remarks |
|---|---|---|---|
| Low | < 500 | 1.5 | Upper limit recommended for fuel-reduction burning |
| Moderate | 501 - 3000 | 6.0 | Scorch of complete crown in most forests |
| High | 3000 - 7000 | 15.0 | Crown fires in low forest types – spotting > 2 km |
| Very High | 7000 - 70000 | > 15.0 | Crown fire in most forest types – fire storm condition at upper intensities |
Rate of spread is the hardest part of the three to measure, but it can be measured in the field using an experimental set-up that will be explained below.
The illustration below shows how the rate of spread apparatus is used in the Territory Wildlife Park fire experimental plots.
Layout for the rate of spread apparatus at the Territory Wildlife Park (click image for larger view) showing arrangement of triangles on burn plots
Fuel load surveys are conducted along transects running the length (east-west) of the plots prior to burning. Smaller back-burning fires are put in along the northern and western boundaries of the plots to make fire breaks that will prevent the main fire front from jumping into the other plots. Two sets of fire-spread apparatus are set out (A and B) so that there is a backup in case one of the systems should fail.
Temperature-resident-time meters (TRTMs) are used to record when the fire moves over a particular point in the landscape. The TRTMs are positioned at the points as marked in the figure below. The TRTMs have a thermocouple which stops the internal stopwatch when the temperature exceeds 200°C (i.e. when the fire moves over that particular TRTM). All TRTMs are synchronised before the burn and each one stops as the fire front moves over its location. It is the difference in these times that are important in calculating the rate of spread.
The illustration below shows the layout of the TRTMs used to calculate the rate of fire spread. The numbers (e.g. T3) refer to individual TRTMs.
Details of the layout and numbering of the temperature-resident-time meters. At the Territory Wildlife Park, the triangle is positioned so that T1 is to the North, and T2 to the South.
Activity: Measuring the rate of spread
What is involved in calculating the rate of spread of a fire?
The description above explains how the apparatus is laid out for measuring rate of spread. With this information fresh in your mind, watch the following video in which Dr Dick Williams explains how the rate of spread of a fire is measured in the field using the Territory Wildlife Park burning experiment.
Read How to calculate Rate of Spread (pdf document) and have a look at the TRTM calculation spreadsheet (Excel spreadsheet) which shows you how rate of spread is used to calculate intensity.
Readings and resources:
How to calculate Rate of Spread (pdf document)
TRTM calculation spreadsheet (excel file)
Depending on site conditions (for example, how dry it is), not all the fuel in an area (total fuel) will burn. The weight of fuel that will burn under given conditions is called the available fuel. The greater the proportion of the total fuel that burns (i.e. increasing available fuel), then the greater the fire intensity and rate of spread.
CSIRO has developed a Fire Spread Meter for northern Australia. It uses five different parameters to calculate the rate of spread in different vegetation types. These parameters are: temperature, relative humidity, fuel moisture content, curing and mean wind speed. Have a look at the image below to see how these are incorporated into the meter. These meters can be purchased through university bookshops.
CSIRO Fire Spread Meter
Point and line ignitions
Ignition type (point or line ignition) can also influence fire intensity.
Line ignitions are typically produced with a drip-torch or ‘fire bug’. These drip burning diesel onto vegetation.
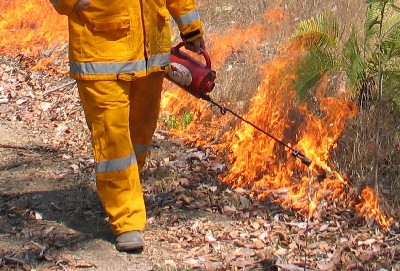
Ignition using a drip- torch
Line ignitions in particular can result in junction zones which are areas of increased intensity caused by two fire fronts (or flanks) burning towards each other. The increased intensity is a result of increased preheating of fuels between the fronts which means they reach ignition temperature in a short period of time. The two fronts appear to ‘draw’ each other when they approach resulting in larger flames and increased intensity, as illustrated below.
(A) Two fronts, (B) Drawing to each other
Point ignitions include fires started with matches or fire bombs dropped from helicopter. The fire therefore starts from just one place. Initially these fires are typically elliptical in form, but alter shape as the fire develops. Elliptical fires tend to be cooler than line fires because the main fire front is much smaller.
Activity: Ignition type & fire attributes
How does ignition pattern affect fire?
The speed at which a fire front forms and fire shape vary depending on whether the fire was a line or point ignition. The following videos show fires resulting from these two ignition types. Have a look at how the fires differ in average flame height, speed of the front formation, and the rate of spread. Also have a look at the illustrations of point (A,B, C) and line (D) fires below.
QuickTime VideoIgnition type
Different shapes of a fire created by different ignition types
Activity: Head and back fires
What are head and back fires?
The diagram below illustrates the different parts of a fire, ignited from a point source. Have a look at where the head and back fires are, as well as flank fires.
Head and back fires (these are sometimes termed heading and backing fires)
Compare the following videos as well as the pictures of head and back fires in savannas. Specifically have a look at how they differ with respect to flame height, direction of the flames, and amount and direction of smoke.
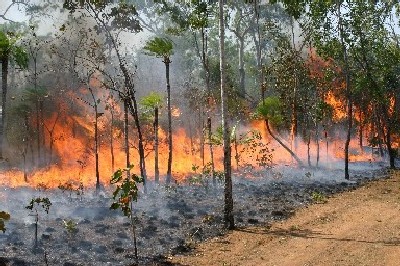
Head fire
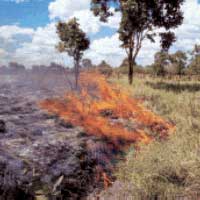
Back fire
QuickTime VideoWatch Backfire
QuickTime VideoWatch Headfire
Post-fire measurements
Post-fire measurements can also tell us about the behaviour of a fire, and in particular, information on fire intensity.
Activity: Char and scorch heights
What can char and scorch heights tell us?
Char and scorch height are related to flame height, and can be used after a fire to provide information on fire intensity. In this video Dr Dick Williams explains how char and scorch height can be determined and how this relates to fire intensity.
QuickTime VideoWatch char and scorch heights
Activity: Summarising fire behaviour
How does fire behaviour vary between seasons?
Williams et al. (1998) provide an excellent overview of the aspects of fire behaviour, weather and fuel characteristics mentioned above, and how they change during the course of the year.
Draw up a table to compare factors influencing early and late dry season fires. Important factors to be considered include: mean temperature, mean humidity, dominant fuel types and mean fuel load. Then compare the predicted mean rate of spread and mean intensity.
Reading:
Williams, R.J., Gill, A.M. & Moore, P.H.R. (1998) Seasonal changes in fire behaviour in a tropical savanna in northern Australia. International Journal of Wildland Fire 8: 227-239.