
Topic 2.1 Human Population
In this topic we will investigate:
- factors affecting human population size
- scenarios for the world’s population during this century
- conflicting opinions regarding the consequences of increasing human populations
- scenarios for Australia’s population.
World Population Growth
Let’s first look at the size of the world’s population throughout human history.
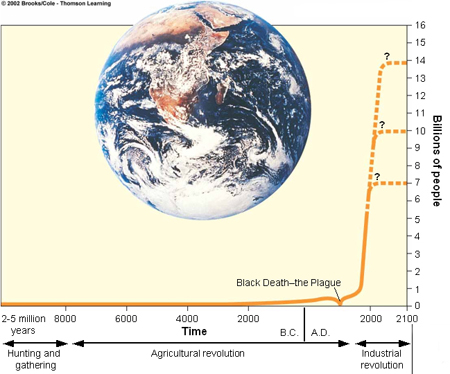
The human population grew slowly for most of human history. Two thousand years ago, the population was about 200 million. By 1850, the population was 1 billion.
In the next 80 years it doubled, then it doubled in 45 years. Our population growth has been exponential since the 19th century.
The milestone of 6 billion people was met in 1999.
For an up to the second simulation of the current world population, go to World POPClock ![]() from the US Census Bureau.
from the US Census Bureau.
![]()
Activity 2.1
- Reflect on on the figure above which shows population growth for over 2000 years. Does it suggest to you a serious problem with human population growth?
- Do you think we can reduce the population growth, or will we continue this trend?
Consider the graph provided and read Miller & Spoolman (2012) pages 125-129.
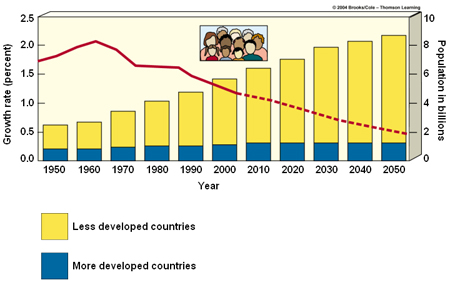
- Describe the pattern of growth rate since 1950. Describe the implications of the growth rate on the human population growth.
![]()
Human Population Growth Rate
Now that we have considered the world’s population growth, let’s consider whether different countries have different trends in population growth, or if the pattern is consistent around the world? Where is the main population growth occurring?
![]()
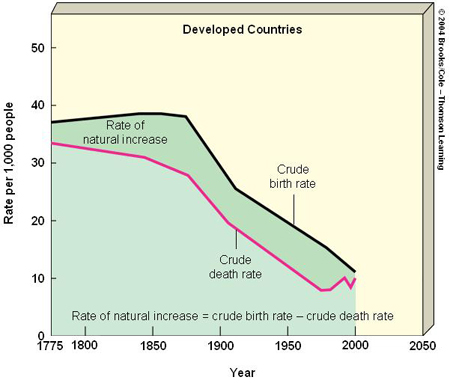
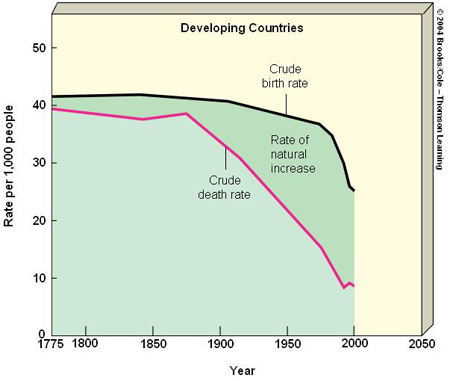
Activity 2.2
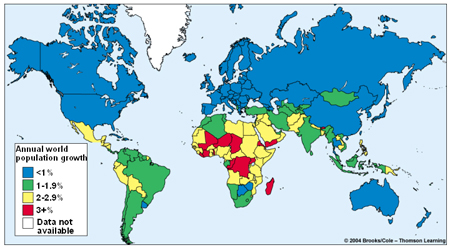
Consider the figure above, from Miller (2005) and note the following:
- The difference in birth and death rates for developed and less developed countries is clear. Population growth is occurring mainly in the less developed countries, particularly Africa, Latin America, and Asia.
- The annual natural increase rate of 1-3% may seem small but leads to enormous increases in population. How many more people will there be in the world next year if the population increase rate is 1.55%? (Answer: 6 billion x 1.55% = 93 million. This is equivalent to adding the population of Australia every three months, or the US every three years).
- Africa has the highest rate of population growth with 13% of the world's population (2.8% in 1996) of any continent, with a population doubling time of only 24 years).
- Asia, with 61% of the world’s population, has the largest annual increase in population. China (1.22 billion) and India (950 million) have the most number of people. Together they make up 38% of the world's population. The United States, with 265 million people, has the world's third largest population but only 4.6% of the world’s people
![]()
What Affects Population Size?
Now that we’ve noted the change in population growth rate over time, let’s consider what affects population size.
![]()
Activity 2.3
- Read Miller & Spoolman (2012) p.130 and name the four components that determine population change. When does population increase? What is zero population growth replacement level population growth?
- What is the mathematical equation that describes the population change?
![]()
What Factors Affect Birth Rates and Fertility Rates?
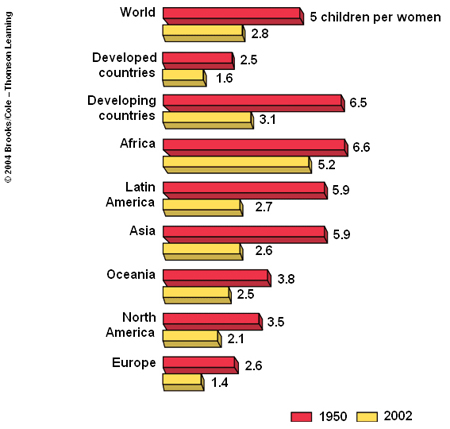
Two types of fertility rates affect a country’s population size and growth rate. These are replacement level fertility and total fertility rate (see Miller & Spoolman (2012) p. 130 for definitions).
Since 1950, there have been substantial declines in fertility levels in the low-income nations, with the exception of Africa.
![]()
Activity 2.4
Read Miller & Spoolman (2012) pages 132-134.
- A number of factors have been found to determine birth rates and fertility rates. Can you suggest what these might be, and how they would affect the rates?
- Why is it important to understand these factors when designing population control programs?
![]()
What Factors Affect Death Rates?
The rapid growth of the world's population over the past 100 years is not the result of a rise in the crude birth rate; rather, it is due largely to a decline in crude death rates especially in developing countries.
For example, between 1900 and 1996 the death rate in the United States fell from 17 to 9 per 1,000 population. More people started living longer and fewer infants died because of increased food supply, better nutrition, improvements in medical and public health technology (such as immunizations and antibiotics), improvements in sanitation and personal hygiene, and safer water supplies (which have curtailed the spread of many infectious diseases).
Scenarios for the World’s Population in this Century
Based on the world’s projected total fertility rate, a number of scenarios for the world’s population have been suggested.
![]()
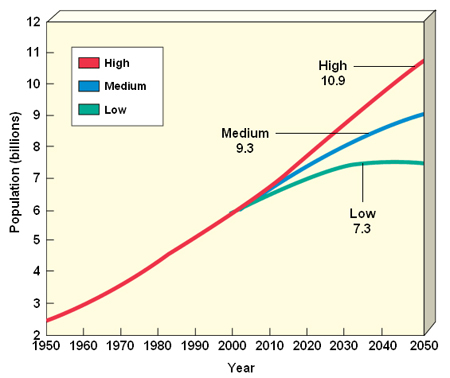
Activity 2.5
Consider Figure 6-2 below from Miller & Spoolman (2009) and read Miller & Spoolman (2012) pages 126-129.
- What is the lowest and the highest world population size predicted in these scenarios for 2050 and 2100?
- What is the most likely prediction of population in 2050? Why is it so difficult to forecast the world’s population in fifty or 100 years time?
![]()
Population Age Structure
As mentioned earlier, even if the replacement-level fertility rate of 2.1 were magically achieved globally tomorrow, the world’s population would keep growing for at least another 50 years. The reason for this is a population’s age structure: the proportion of the population (or of each sex) at each age level.
![]()
Activity 2.6
Read Miller & Spoolman (2012) pages 134 – 139.
- What is the age structure of a population?
- What are the problems associated with a baby boom and a declining population?
![]()
Scenarios for Australia
Various models have been developed to estimate the likely population size Australia will have by the middle of this century? Models suggest that:
- assuming medium fertility rates, and high overseas migration, the population is projected to grow to ~26 million by 2041
- assuming medium fertility rates, and low overseas migration, the population is projected to grow to ~24 million by 2041.
What Should Australia Aim For?
Again, there are debates about what size our population should be (Yenken & Wilkinson 2000).
- The arguments in support of increased migration and population growth include
- the argument that Australia is a vast country with empty land to be filled
- the argument that Australia needs more people or its overpopulated neighbours will choose to fill the space
- a moral duty to take excess population from other nearby overpopulated and poor countries
- that we need to continue population growth for economic prosperity (Yenken & Wilkinson 2000).
- Those opposing this view include the arguments that
- there is a social cost of migration in times of high unemployment
- the environmental impact will be too great
- Australia cannot support a larger population.
- This includes pressures in particular areas, e.g. the greater concentrations of people along the coastline especially the eastern and south-eastern coastline.
- Increases in the size of our cities and towns
- Increased pressures on the land from the need to feed and support additional people (Yenken & Wilkinson 2000).
- To date, Australia has failed to produce a population policy.
![]()
Additional Reading
A number of Web sites outline the issues of population growth and population targets in Australia.
http://www.onlineopinion.com.au/view.asp?article=1905
http://www.labshop.com.au/dougcocks/abernethyfinal.htm
The Future eaters: some further thoughts on population policy / Tim Flannery. - pp.1-3.
Source: People and place. - v.3, no.4, 1995.
![]()
Activity 2.7
- Considering your own experiences, and considering the arguments listed above, what do you think Australia’s population policy should aim for?
- Do you think we are already over the maximum population that Australia can support given the environmental resources available? On what basis have you formed this opinion?
Consequences of the Increasing Population: Conflicting Opinions
The projected doubling of the human population from 5 to 10 billion between 1985 and 2050 raises some important questions. Two massive questions that need to be addressed are:
- Can we provide enough food, energy, water, sanitation, and education, health care and housing for twice as many people?
- Can we provide an adequate standard of living for twice the number without causing massive environmental damage?
![]()
Activity 2.8
Three major views have been expressed about whether population growth is a major threat to the environment, economy and political stability. Read Miller & Spoolman (2012) pages 139-144.
- List the ways in which population size can be influenced giving examples of each.
![]()
Review Questions
1. Define birth rate, death rate, emigration rate and immigration rate. Write an equation to mathematically describe the relationship between these rates and the rate of population change.
2. Distinguish between replacement-level fertility and total fertility rate. Describe how total fertility rate affects population growth. List at least five factors that affect birth and fertility rates and five factors that affect death rate.
3. Describe and compare rates of population growth in developed countries and developing countries. Explain the differences you find.
4. Using population age structure diagrams, explain how the age structure of a country creates population growth momentum. Summarize problems associated with a baby boom and a declining population.
5. You are in charge of a population policy for Australia? What issues would you consider in forming a policy, and what steps would you undertake in preparing one.
![]()