An Introduction to Graphing
When used well, charts or graphs are a powerful communication tool for data in a worksheet. As the saying goes a picture is worth a 1000 words or as this example shows at least 700 words. Graphs should be used to reveal the information and trends in the underlying data.
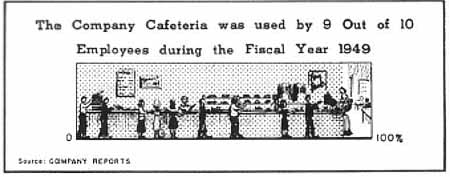
There are a number of principles that should be followed to create effective graphs. To illustrate these principles, examples of both good and bad graphs will be given. These principles include :- Graphs should have a significant message to portray. It does not make sense to use a graph to show one or two values as the human brain is quite capable of grasping this. The company cafeteria and NT news phone poll are some examples of what not to do.
- Graphs are only as good as the data they graph. If the underlying data is weak or poorly considered, no graph will be able to rescue it as the stock prices show.
- The graph should clarify the message not confuse it as Have something to say illustrates.
- The scale used for a graph needs to:
- stay consistent throughout its length. As the example Rubber band scales illustrates changing the scale part way through creates quite a different impression!
- generally start at zero: As this example shows, not starting graphs at 0 can totally distort the message. Sometimes, though, this technique is justified.
- Space on graphs should be directly propertional to the numerical quantity represented, i.e. a value that is twice as big should take twice the space. Consider the Lie Factor examples that over exaggerate their point.
- Put the information shown on a graph into a reasonable context as Context: Compare to what? illustrates.
As the following graph clearly illustrates the outgoing mail of the US House of Representatives peaks every two years, just before the election day:
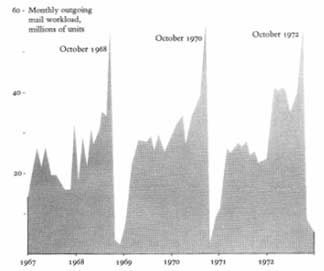
The graphic is worth at least 700 words, the number used ina news report describing how incumbent representatives exploit their free mailing privileges to advance their re-election campaigns:
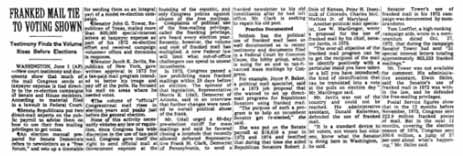
Extract from p.37 in Tufte, E. 1983. The Visual Display of Quantitative Information. Graphic Press, Cheshire Connecticut.
Don't use graphs for small amounts of information
In the following graphs, do you get the message from the graphic or the text?
graphic source: http://www.stat.auckland.ac.nz/~ihaka/120/lectures.html
Is it used in the next example to give a psuedo scientific credence to the poll?
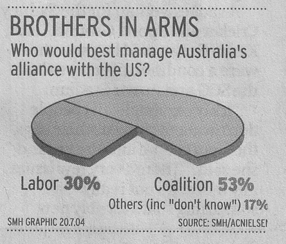
Source: Sydney Morning Herald, 20/07/2004 p.1
Of course, statistical graphics, just like statistical calculations, are only as good as what goes into them. An ill-specified or preposterous model or a puny data set cannot be rescued by a graphic (or by a calculation), no matter how clever or fancy. A silly theory means a silly graphic:

Extract from p.15 in Tufte, E. 1983. The Visual Display of Quantitative Information. Graphics Press, Cheshire Connecticut.
While it can generally be argued that scales should start at zero, there are times when it is reasonable they do not. For example consider the graphs below that look at the changes within a day.
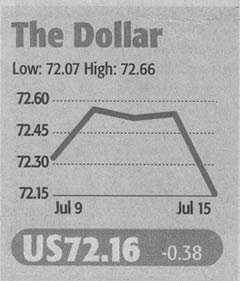
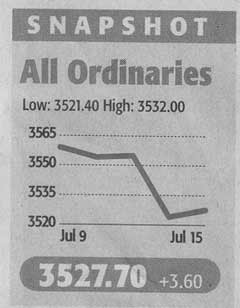
Source: The Australian, 16/07/2004, p.17
Here the graphs are directed at a specialist group of readers who understand the background context of the graphs. These readers are interested in the small intra-day changes the graphs highlight. They are not going to be deceived by the scale not starting at 0.